This post is mostly for fun and educational purposes. So, there are a lot of common methods in areas of sound and image processing. For example, Fourier, wavelet transforms are used heavily for analysis and compression of both audio and video. In addition, there are a lot of different denoising filters based on the same ideas, etc.
One reason for that (as I think), because sound can be considered as a one-dimensional movie (from processing point of view). If an image is 2D function, mapping brightness (intensity, amplitude) to pixel position then a movie is just a change of this function over time (so it is 3D in the end). With audio it is a bit different.
Roughly speaking, if we consider sound as a sequence of consecutive events then at each moment of time it can be described as just one-dimensional function. When someone hears sound or song or melody, at each discrete moment of time it can be described as a combination of different tones (notes) of different volumes. This one-dimensional function is just a dependence of volume (amplitude) from pitch (frequency). This is actually what Fourier transform is about, in short. And so every sound can be transformed to a picture.
To do so, one needs to see changes of this one dimensional function over time. This is what is called spectrogram. Usually on x-axis is time, on y-axis is pitch and the brightness corresponds to volume. To understand it better, here is real time spectrogram generator of different sounds from amazing project called “Chrome Music Lab” (requires Chrome browser, Node.js, I think). One of the simplest ways to see a spectrogram of your favorite sound is open “Spectrogram view” in free sound editor Audacity.
Ok, so if a sound can be transformed to a picture then can it be made another way around? Surely, by reverse mapping. So image x-coordinate is mapped as time, y as tone and brightness as volume. It was done by many artists in the past, most famous being Aphex Twin.
One peculiar thing that is used in scientific image analysis is kymograph: mapping of 1D intensity over time. This resembles previously given strange definition of sound a lot, so using some matlab code I decided to figure out, how kymographs would sound when transformed to audio.
I picked some typical kymos from molecular biology field. First one is a kymo of EB-comet in vitro. EB is a protein tracking growing ends of microtubules, long polymers inside cell.
This is how it looks like:
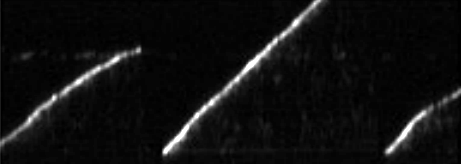
x-axis (horizontal) is time and y-axis is position (corresponding to length of microtubule). I took it from this paper we published some time ago. And this is how it sounds like:
It is quite easy to determine by ear moments when growth stops and resumes.
And this is how kymograph will change if you add anti-cancer drug dolastatin:
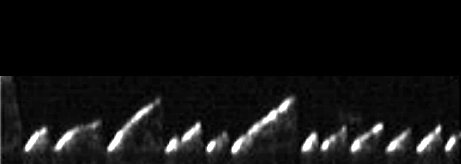
Difference in comparison with first example is easy to see at the picture, but also it’s possible by just listening to the audio. This is how microtubule will sound now:
Reminds me of some 90’s electronic era, when people were using first generation of synthesizers with clean frequencies.
But here is something more of contemporary dubstep/noise/ambient. It is kymo of bidirectional transport inside flagellum from this paper:
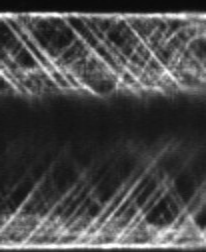
and corresponding sound:
Well, if you have any other interesting kymos/pictures that you want to hear, let me know in comments.
0 Comments