Last couple of weeks I was reading, coding and playing with spatial/temporal cross-correlation for microscopy image/movie analysis. I’m going to summarize my findings in a series of posts, before I forget everything. It is going to be a long story, so buckle up.
First of all, motivation, or why would one use cross-correlation (before explanation of what it is)?
Interesting fact: according to this paper, this method was used for special effects
in movies such as Cliffhanger, Forest Gump, and Speed. Recently cross-correlation based feature trackers have been introduced in commercial image compositing systems such as Flame/Flint, Matador, Advance, and After Effects.
Since Forrest Gump is one of my favorite movies, I did some googling and found this video where special effect team explains how they did tricks. It is quite long (but interesting), so I’m going to give links to relevant moments below. Mostly cross-correlation was used when inserting Tom Hanks to historical footage, like when he gets medal from Nixon or on TV show with Lennon or plays ping pong with Bush. Remember the last scene? I also don’t remember, since it was not used in the final movie after all. But I use it as an example for the explaination. First, they removed Bush partner from footage and then they filmed Tom Hanks with blue background (which can be easily removed) hitting ping pong balls in sync, using immobile camera.
Now, to realistically overlay Tom Hanks on historic footage, one needs to know how camera was moving/shaking on that historic movie, since it was not a static shot at all. And make Tom Hanks studio footage shake/move to the same extent and pace, so they are in sync and overlay perfectly. Of course, there is no coordinate data on position of that old camera. No iPhone or small gyroscopes were invented yet. This is where cross-correlation kicks in. They used it to track a movement of some small immobile feature at the background (chair, curtain, etc) to record its displacement from frame to frame.
In the video crew doesn’t mention, what exact feature they used for tracking. But to get an idea, here is some fragment of youtube tutorial on After Effects, where tracking is illustrated with Beatles footage.
How does it relate to microscopy? The same principle lies behind a variety of microscopy plugins (StackReg, Template matching, NanoJ, ThunderSTORM, DoM and forgive me if I don’t mention them all) to compensate for the microscope’s stage drift. Since everything is relative, stage drift is kind of like camera drift/shake.
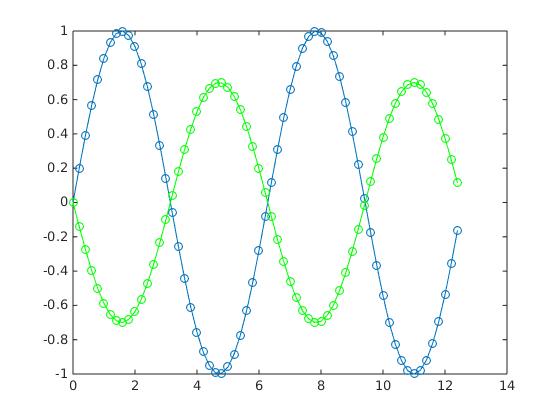
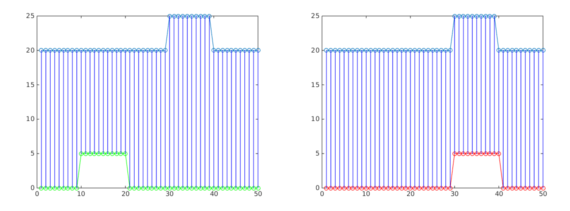
But what is general idea behind using specifically correlation? Let’s consider it on an example of two consecutive footage frames. The main task is: if one has a feature at frame 1, try to find best shift in x and y of frame 2 that will maximise the overlap. So for any values of shift in x and y of frame 2 we have a function that reports, how bad (or good) the overlay is between frames 1 and 2. What kind of function that would be? The answer lies in the same paper and I will illustrate it on 1D example. Let’s suppose we want to find an optimal shift between green and blue functions:
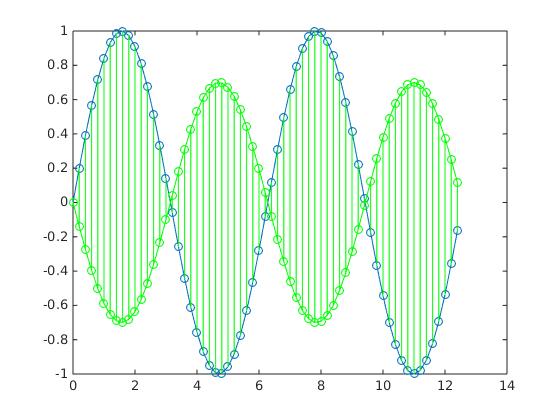
Motivation is to use Euclidean distance between these two functions, i.e. count summary length of all vertical green lines at each point of x:
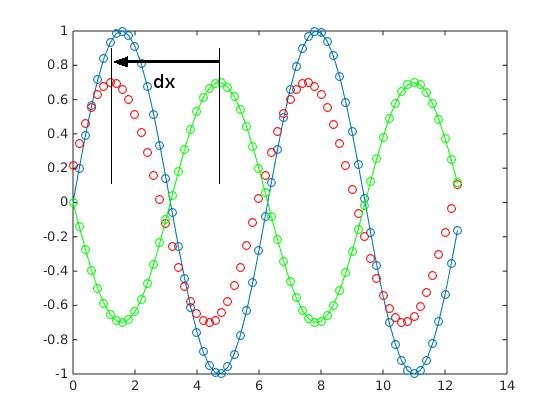
Now, if we shift green function to some distance dx and plot it with red circles:
Summary distance between blue and red curves (sum of all vertical red lines) will become smaller:
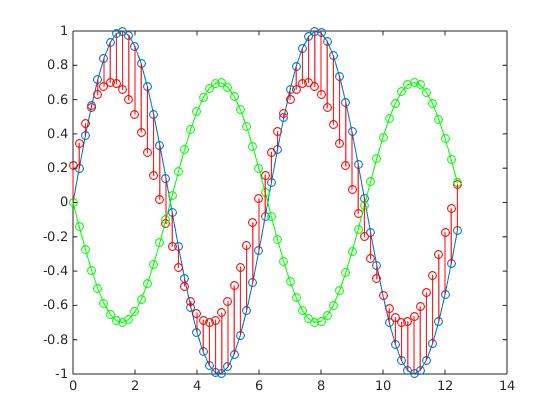
If they overlap completely, it would be equal to zero. So it seems it is a good measure of similarity. In the end we need to find a minimum of this function (Euclidean distance) for all possible values of dx. This is the general idea behind cross-correlation methods. As it often happens, to make it work in practice, there are a couple of challenges.
First, this method should overcome different ‘overall’ brightness of images. For example, on the next picture summary distances between blue curve and green and red are the same, but it is clear, that in the right image feature fitting is better.
Second is that the calculation procedure is very computationally demanding (for all shifts calculate all sums at all points!). So it needs some optimization.
I will write about ways to overcome these limitations in the following post.
Update: here is link to videorecording of my lecture about applications of correlation methods given at Seasonal Utrecht Microscopy meetings.
0 Comments