Brief intro:
About a year ago me and Jalmar were working on the automated methods of line/curve extraction from images (mostly microtubules in microscopy pictures, but not limited to). There are a lot of different methods, but after some research we concluded that one of the basic and “essential baseline control” was Carsten Steger’s “An Unbiased Detector of Curvilinear Structures” published in 1996 (~830 citations since then). The paper describes method in all details and what is even more interesting, there was a link to ftp with open source code. Unfortunately almost 20 years later this ftp was down and so we tried to reconstruct code according to description in the paper with some success.
Still comparing our own line tracing methods with such a “reconstruction” didn’t seem to be fair. About two month ago I’ve found original source code incorporated into GRASP package under GNU license. It was written in C and I decided to port it into Java based ImageJ/FIJI because:
- while adapting it I would understand how it works in details;
- it will become a part of modern image analysis package.
It was indeed a lot of fun to understand how it works and wrap my mind around data structures/transformations from C to Java. The code itself is very well optimized for perfomance (on 1996 computers) with heavy and smart usage of pointers and references, memory handling, etc (check it out). So it was not only an “algorithm” challenge, but also “how well you know C and Java”. Not sure I did my best in that, but at least it should work without major flaws.
When it was ready I emailed to prof. Steger (better late than never) and he answered that the code was already adapted by for FIJI by Thorsten Wagner about half a year ago. Here is link to Ridge Detection plugin’s FIJI webpage. Looking through his code I must take my hat off as I think he did much better adaptation job than me.
Anyway, it was very educational exercise for me and now it is too late to press ‘delete’, so I’m going to briefly describe algorithm using my code and show some examples\application of how it works on the data I have.
Curve tracing
First of all, here is link to our plugin, called CurveTracing. Most parameters are quite obvious. After setting parameters, there is additional interactive window/image/colormap that asks for two thresholds. Blue color marks area where tracing will happen (no line outside this region will be found). Green color specifies “seeds” from which the growth will start. Threshold values can be fractional!
For example, if you put thresholds like this:
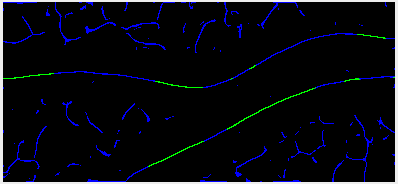
Example of two thresholds for line tracing
It will result in the final tracing looking like this:
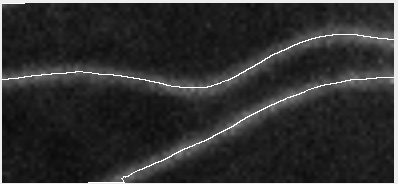
Result of tracing
Basically, all missing blue short lines will not be traced, since they don’t have green seeds in them.
Obviously resulting data is exported to results table, Roi manager and overlay. Also I’ve added some details and intermediate calculated features to “Debug/learning” parameters section to generate some images like this:
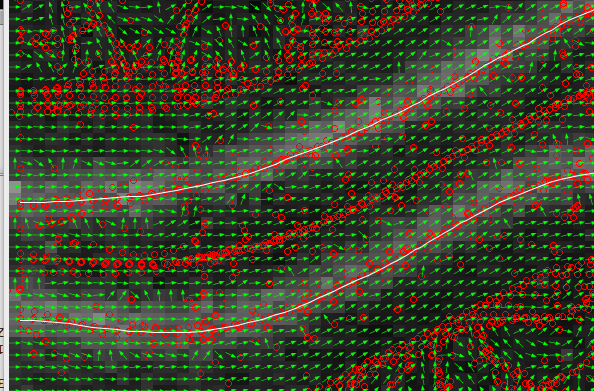
Debug features: eigenvectors and subpixel positions
If you want to learn more about it, you should read the paper and these visualization features really help to understand it.
Examples
Ok, so here are some examples of tracing. First, microtubules:
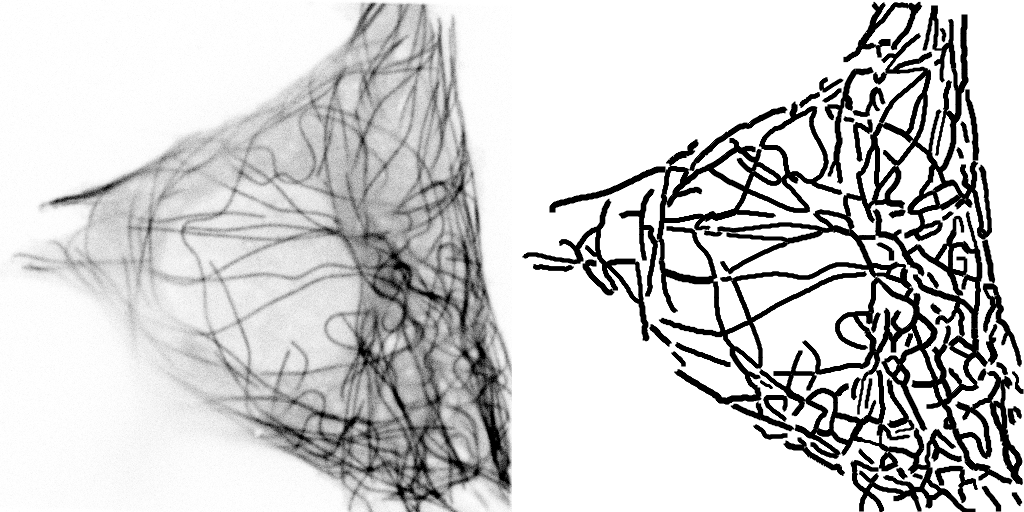
Microtubules (left) and result of tracing (right) (click to enlarge)
This image actually highlights that the algorithm/plugin finds individual line contours (segments), rather than full lines. It can be seen better on this image, where every line is coded with different color.
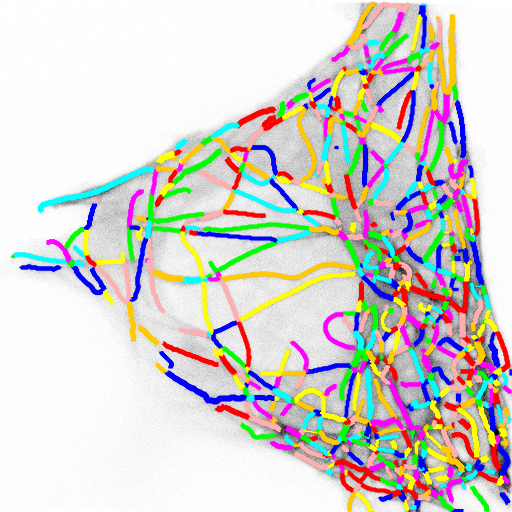
Colorcoded output
So essential extension/improvement would be to link those segments into full line. So intersections need to be resolved, retraced, etc. Also plugin works with stacks:
Microtubule in vitro gliding assay video I got from youtube
And finally! Original algorithm was developed to trace maps. Here is my attempt of Google Earth picture of our campus in Utrecht:
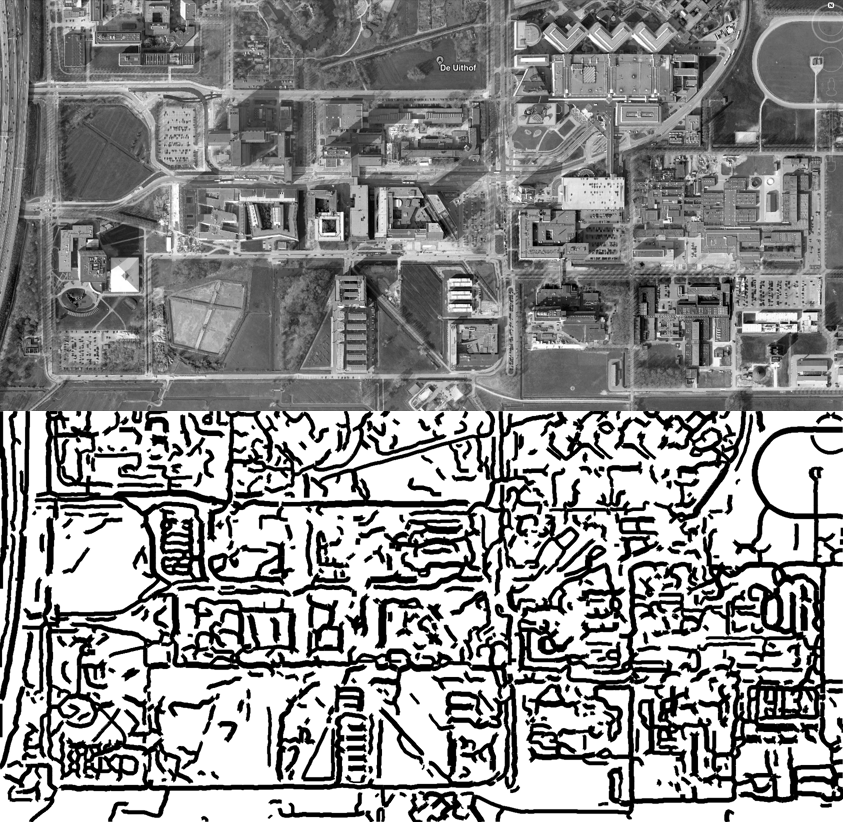
Utrecht University campus map (click to enlarge)
Hello,I meet the same problem.I also want to port it into C++.Your description above is very useful to me. Thank you!
you port it in C++?
i could not understand anything in the paper ,i dont know how can i implement until understand it